
Funding for Operating Costs
 Image source: Paperchaseue 2012
The literature available for funding rail transit often focuses on the system's capital costs, due to the large amount of funding required to successfully establish a new system. However, over a given system's lifespan, operating costs can easily run much higher than the initial capital costs -- easily doubling or tripling capital costs. Therefore, it is important to have a general understanding of the mechanisms available for providing long-term funding for a rail transit system's operating costs.
Operating costs include: operator and administrative salaries, maintenance on the system, and materials and supplies necessitated by the system; of these the largest cost, by far, is the salaries of those who work to support the system (Garrett 2004, 6). The revenue supporting these operating costs comes from two general sources: federal, state, and local funding (between 60% and 70%) and from fares generated from the system itself (approximately 30% for many US light rail systems) (Garrett 2004, 6). Funding from the federal and state levels often takes the form of grants, discussed elsewhere in the Economics page (Garrett 2004, 6). At the local level, a portion of a community's sales tax is often used to subsidize the operating costs of public transit.
The fraction of income from fares and a system's total operating cost is generally known as the fare-box recovery rate. Whatever portion of the operating cost that is not recovered via a transit system's fares is known as its subsidy. Significantly, all US rail transit systems are subsidized, although the rates of subsidies vary considerably. Buffalo's underutilized light rail system only covers about 21% of its operating costs with fares, while the New York City subway covers 55% (Keatts 2013; Levinson 2013). However, results from abroad are a little more encouraging, with Hong Kong operating its system at a profit, with a fare-box recovery ratio of a whopping 185%, netting $2 billion in profits for its operator (Padukone 2013). This relates to the city's dense settlement patterns and its culture of depending heavily on mass transit to get around instead of private automobiles (Padukone 2013).
Defining what represents appropriate levels of subsidies for public transit is controversial, as there is no generally accepted 'target' level of fare-box recovery (Guerra and Cervero 2011; Taylor and Norton 2009). Again, systems situated in areas with the highest levels of density generally require less subsidies to operate than those situated in less dense areas (Garrett 2004, 8). The metric to determine a rail transit system's effectiveness is often stated as operating cost per passenger mile or operating cost per vehicle mile (Guerra and Cervero 2011).
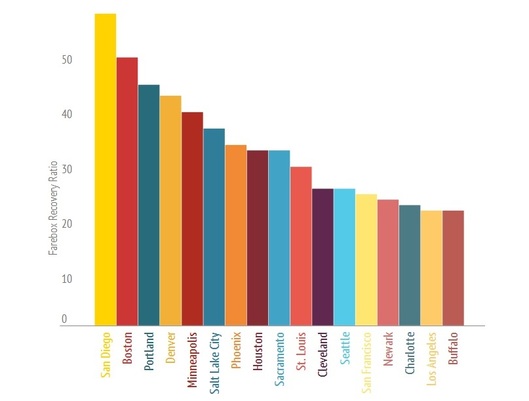
Farebox recovery ratios for different US light rail systems | Image source: Keatts 2013
It is often said that light rail systems are more efficient than bus rapid transit (BRT) systems, as light rail systems have a much higher passenger capacity per operator; thus light rail systems can make up for much higher capital costs over the long term, because they have lower annual operating costs (MacKechnie n.d.). However, savings on operating costs between light rail and BRT systems hinges on having high levels of system demand to actually be realized (MacKechnie n.d.). Here again, population density is the key, as systems situated in high levels of density naturally have more overall demand. Another section of this website further delineates the light rail / BRT debate.
